

India reported its first coronavirus case on January 30 when a medical student who returned to Kerala from Wuhan in China, tested positive for the disease.
The virus cycle has completed six months and, on July 30, 15,88,129 cases were reported in India. The country stands only behind USA and Brazil in terms of total caseload. Here is an analysis of India's Covid-19 journey over the last six months:
THE JOURNEY – FROM 1 TO 15,88,129
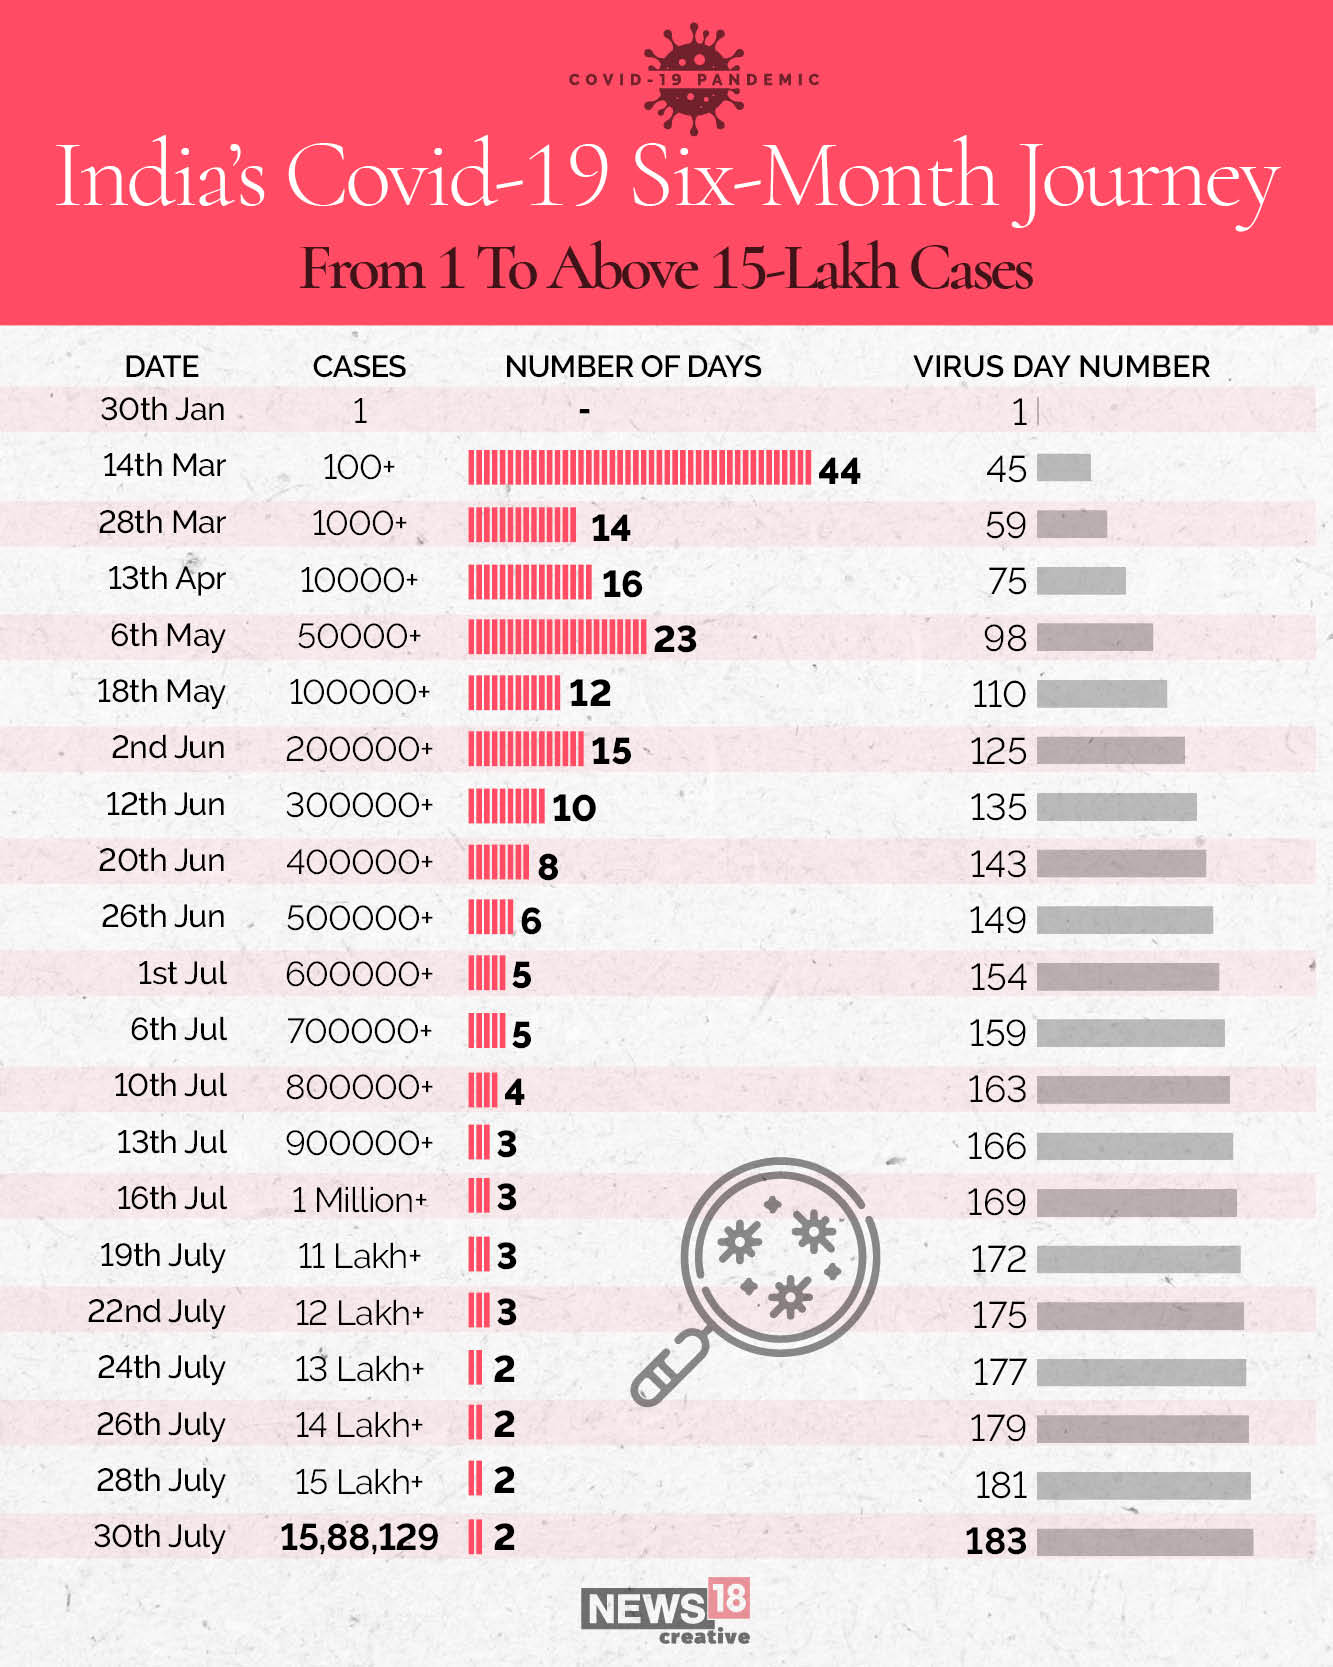
From January 30 - taking the day the first Covid-19 case was reported in India as Day 1 since the Covid-19 pandemic took root in India; the country took 45 days to cross 100 cases, 59 to cross 1,000 cases, 75 to cross 10,000 and 98 to cross 50,000 infections.
India crossed the milestone of 1 lakh cases on May 18. It took another 15 days to reach 2 lakh cases. Since then, the number of days to add an additional lakh cases has progressively gone down.
The nation crossed 1 million cases on July 16; day 169. The country now has a total of 15,88, 129 cases on July 30; Day 183 of the pandemic in the country.
68 DAYS OF THE LOCKDOWN AND WHY IT WAS EFFECTIVE
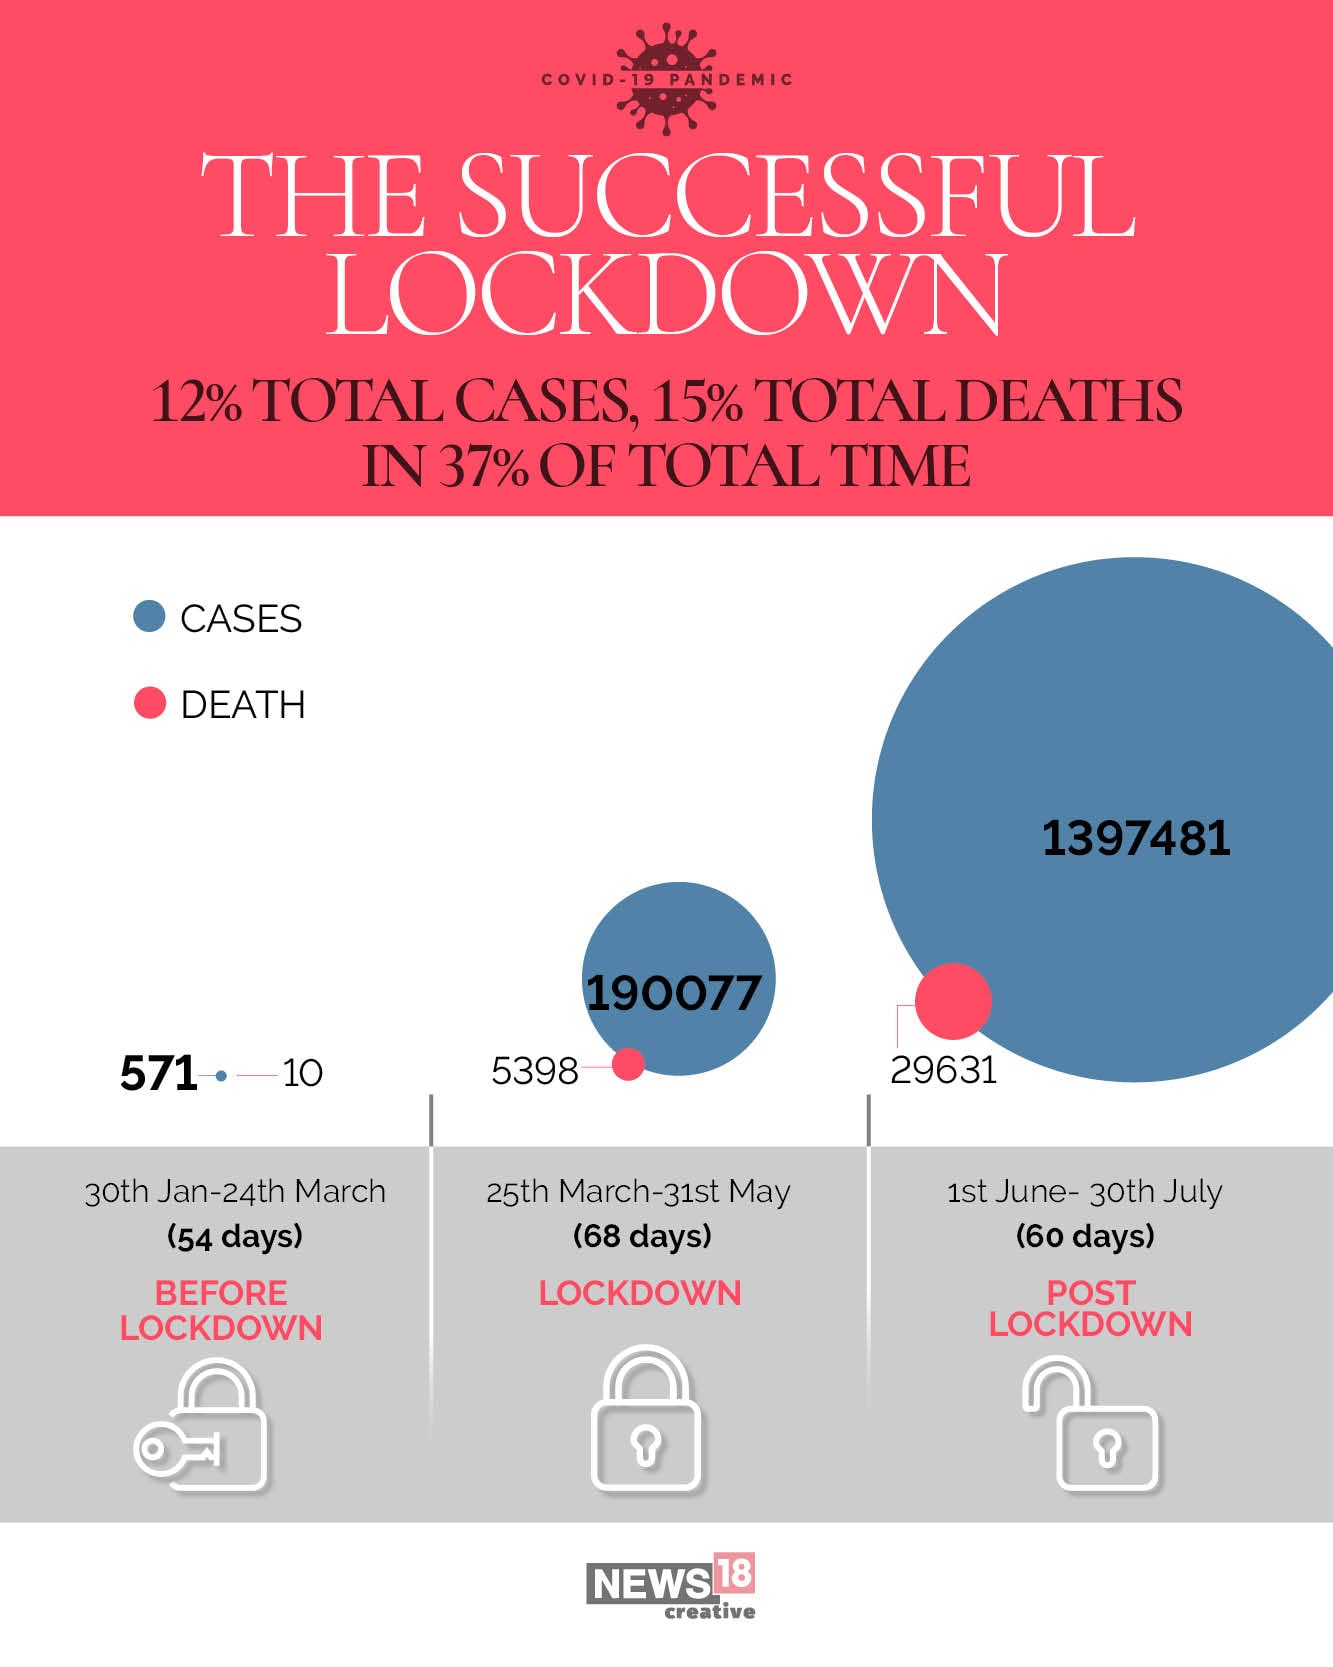
India had a total of 571 cases and 10 fatalities when it imposed a nationwide lockdown on March 25. After 68 days of the stringent curbs, the country reported a cumulative 1,90,648 cases and 5,408 deaths on May 31.
The lockdown accounted for 1,90,077 cases and 5,398 deaths. In the next 60 days, the country has reported more than 7 times the number of cases and almost 5.5 times the number of fatalities.
This, in effect means, that the lockdown which lasted for 37% of the total virus-cycle time in India, accounted for barely 12% cases and a little more than 15% of the total number of Covid-19 deaths in the country.
The most significant impact of the lockdown was that it helped keep the mortality numbers low. It also gave the authorities time to ramp up health infrastructure and medical facilities to prepare for the future.
CASES HAVE SURGED POST LOCKDOWN
From the total cases, 88% infections and 85% of total fatalities in India have been in the 60 days post the lockdown period from June 1.
The country reported its highest single-day surge of 52,479 cases on July 29, and has recorded more than and around 45,000 new cases daily since July 22 - the day which also saw the country's highest single-day death toll of 1,130. More than 700 daily fatalities have also been reported in the last 8 days with the exception of the July 27.
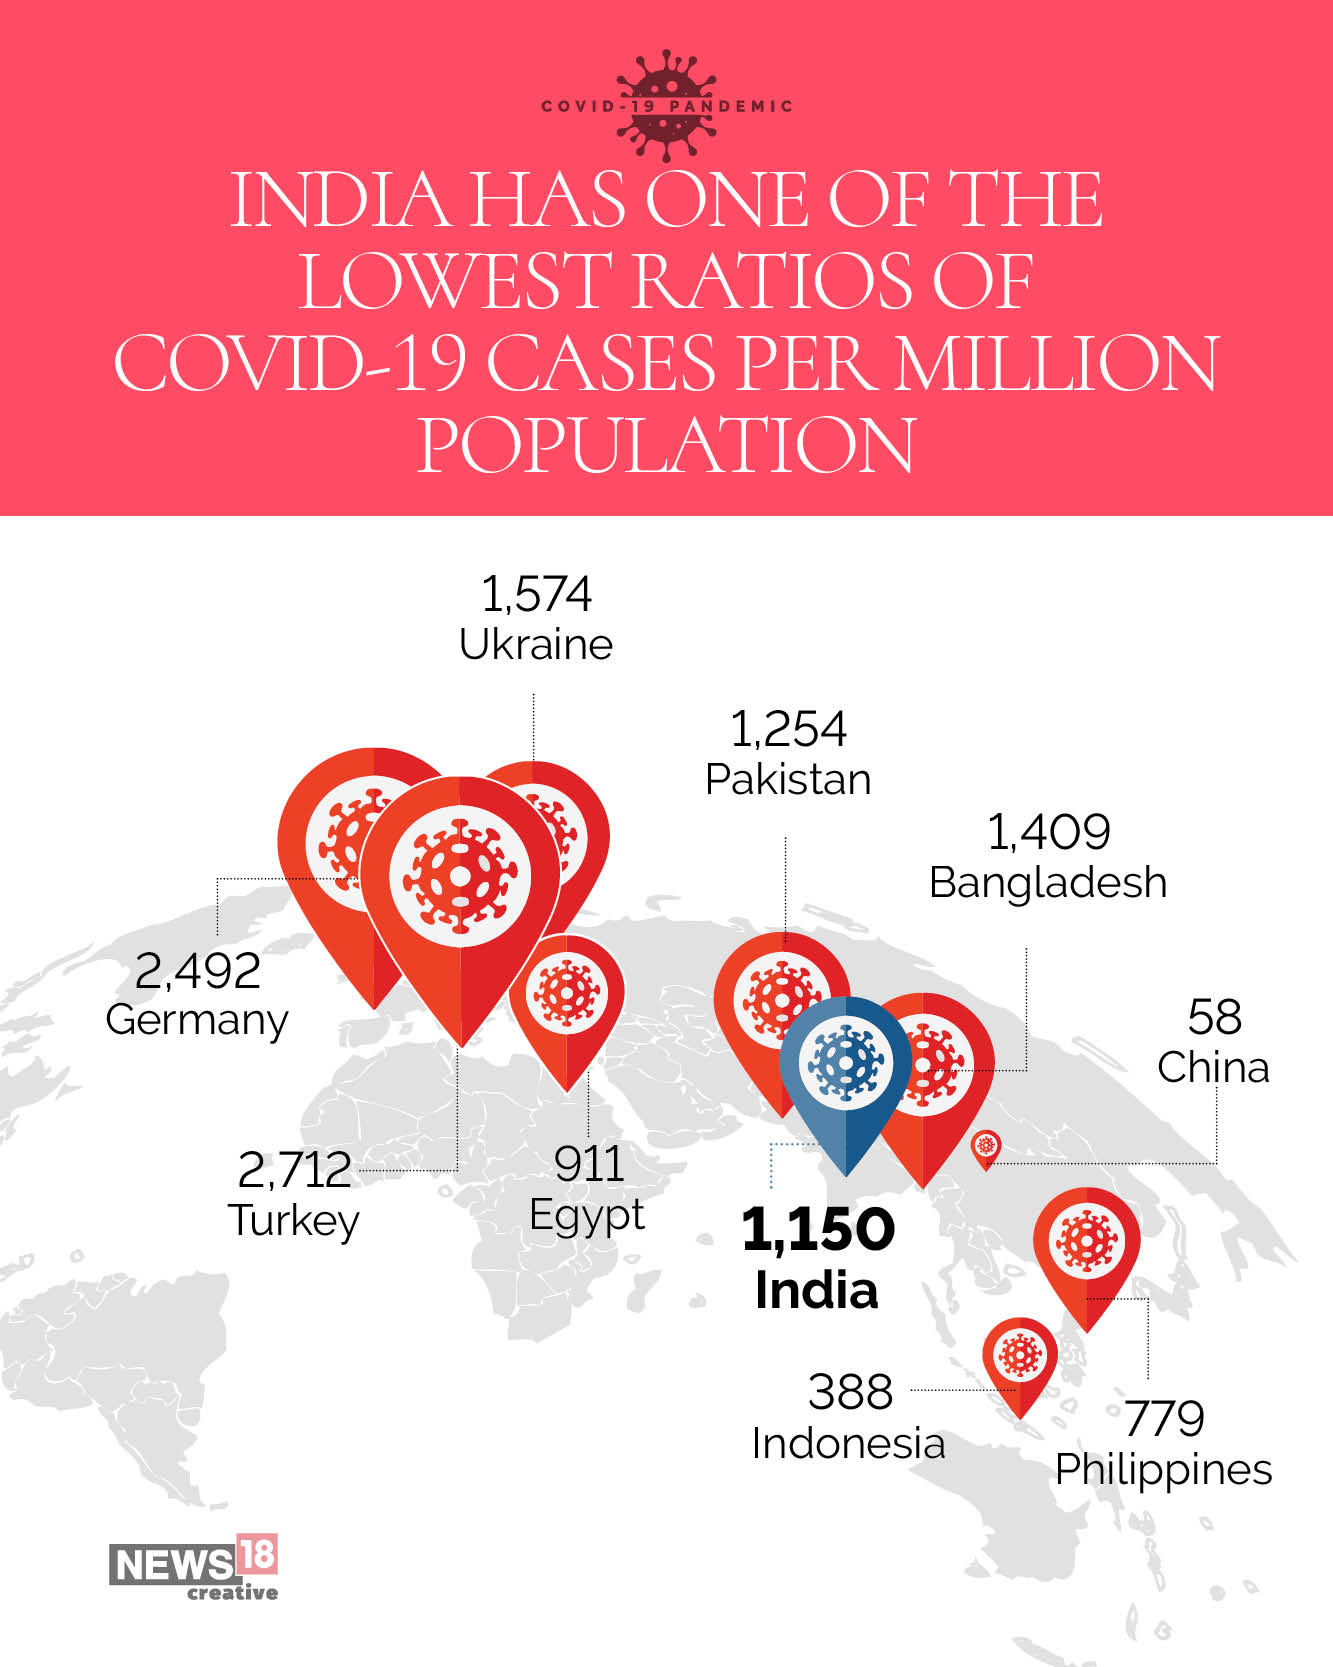
However, despite the caseload, in terms of Cases Per 1 Million Population, which is a better indicator of measuring the spread of the virus, India with 1,150 cases per 1 million of its population, is at number 5 among 43 countries which have reported at least 50,000 cases.
POSITIVITY RATE ON THE RISE BUT STILL LOW
India ramped up its testing to above 1 lakh per day from May 18. From June 23 to July 13, the country tested more than two lakh samples per day. This was further increased to 3 lakh-plus from July 14, and post July 24, the sample size has gone above 4 lakh. The country tested 5,28,082 samples on July 27 – the maximum done in one day.
Usually, with increased testing, the Positivity Rate decreases. However, India’s Cumulative Positivity Rate has risen from 3.86 per cent on April 30 to 4.97 per cent on May 31. It has increased to 6.64 per cent on June 30 and later to 8.73% per cent on July 30. This means that every 11 people tested in the country have so far been Covid-19 positive.
Cases in India continue to rise at a rate faster than the number of tests being conducted. India’s Positivity Rate places it at Number 23 among the 43 nations under analysis. It is better than countries like Sweden (9.85%), Pakistan (14.21%), South Africa (16.4%), Brazil (20.28%), among others.
India’s Daily Positivity Rate (taken as a 7-day rolling average) rose sharply post the lockdown and peaked at 12.3% on July 25. However, it has seen a dip in the last few days which is an encouraging trend. Currently, one in every 8 people being tested turn out to be Covid-19 positive in India.
However, one area that India seems to have fared well is the relatively low number of Covid-19 deaths reported in the country.
LOW MORTALITY NUMBERS
India has recorded a total of 35,039 Covid-19 fatalities on July 30, which places it at number 6 after USA, Brazil, UK, Mexico and Italy.
However, this number should be seen also in context India's humongous population of over 138 crores.
There have been 25 Covid-19 deaths in India per 1 million population. Countries like China, Singapore, Philippines, Indonesia and Bangladesh have fared better on this count.
India’s Mortality Rate (MR) peaked on May 6 when it reached 3.4% - however, this was significantly lower than the peaks of some other nations. For example: USA had a peak of 6.1%, UK – 15.7%, Italy – 14.5%, France – 19.6%, Spain – 12.2%, Brazil – 7%.
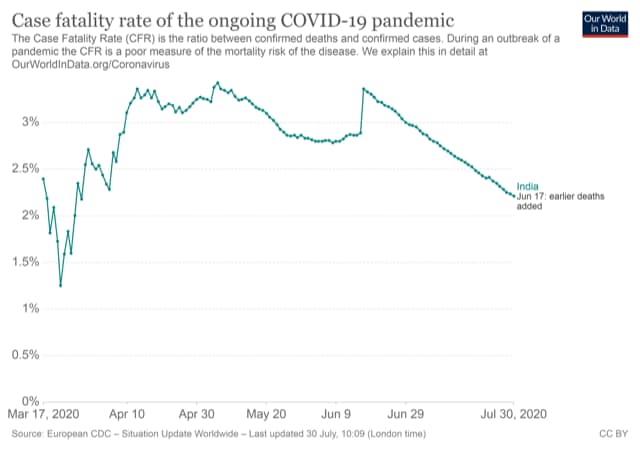
The mortality rate came down amid the stringent lockdown to 2.8% by the end of May, after which the easing of curbs and restrictions saw the MR rising to 3%. There was a sudden surge on June 17, when a backlog of deaths were reported and the MR shot to 3.4%. However, since then, there has been a continuous decline and it has dropped to a lower figure - 2.2% on July 30.
India’s MR is lower than countries like USA (3.37%), Brazil (3.53%), Germany (4.41%), China (5.51%), Sweden (7.18%), Italy (14.24%), UK (15.25%) and France (16.33%) among others.
India has conducted 519 tests per Covid-19 death – this number is more than the corresponding number for Canada (437), USA (368), UK (337), Spain (235), Belgium (161), Sweden (141), Brazil (140) and France (99) among others.
Worst 10 Districts
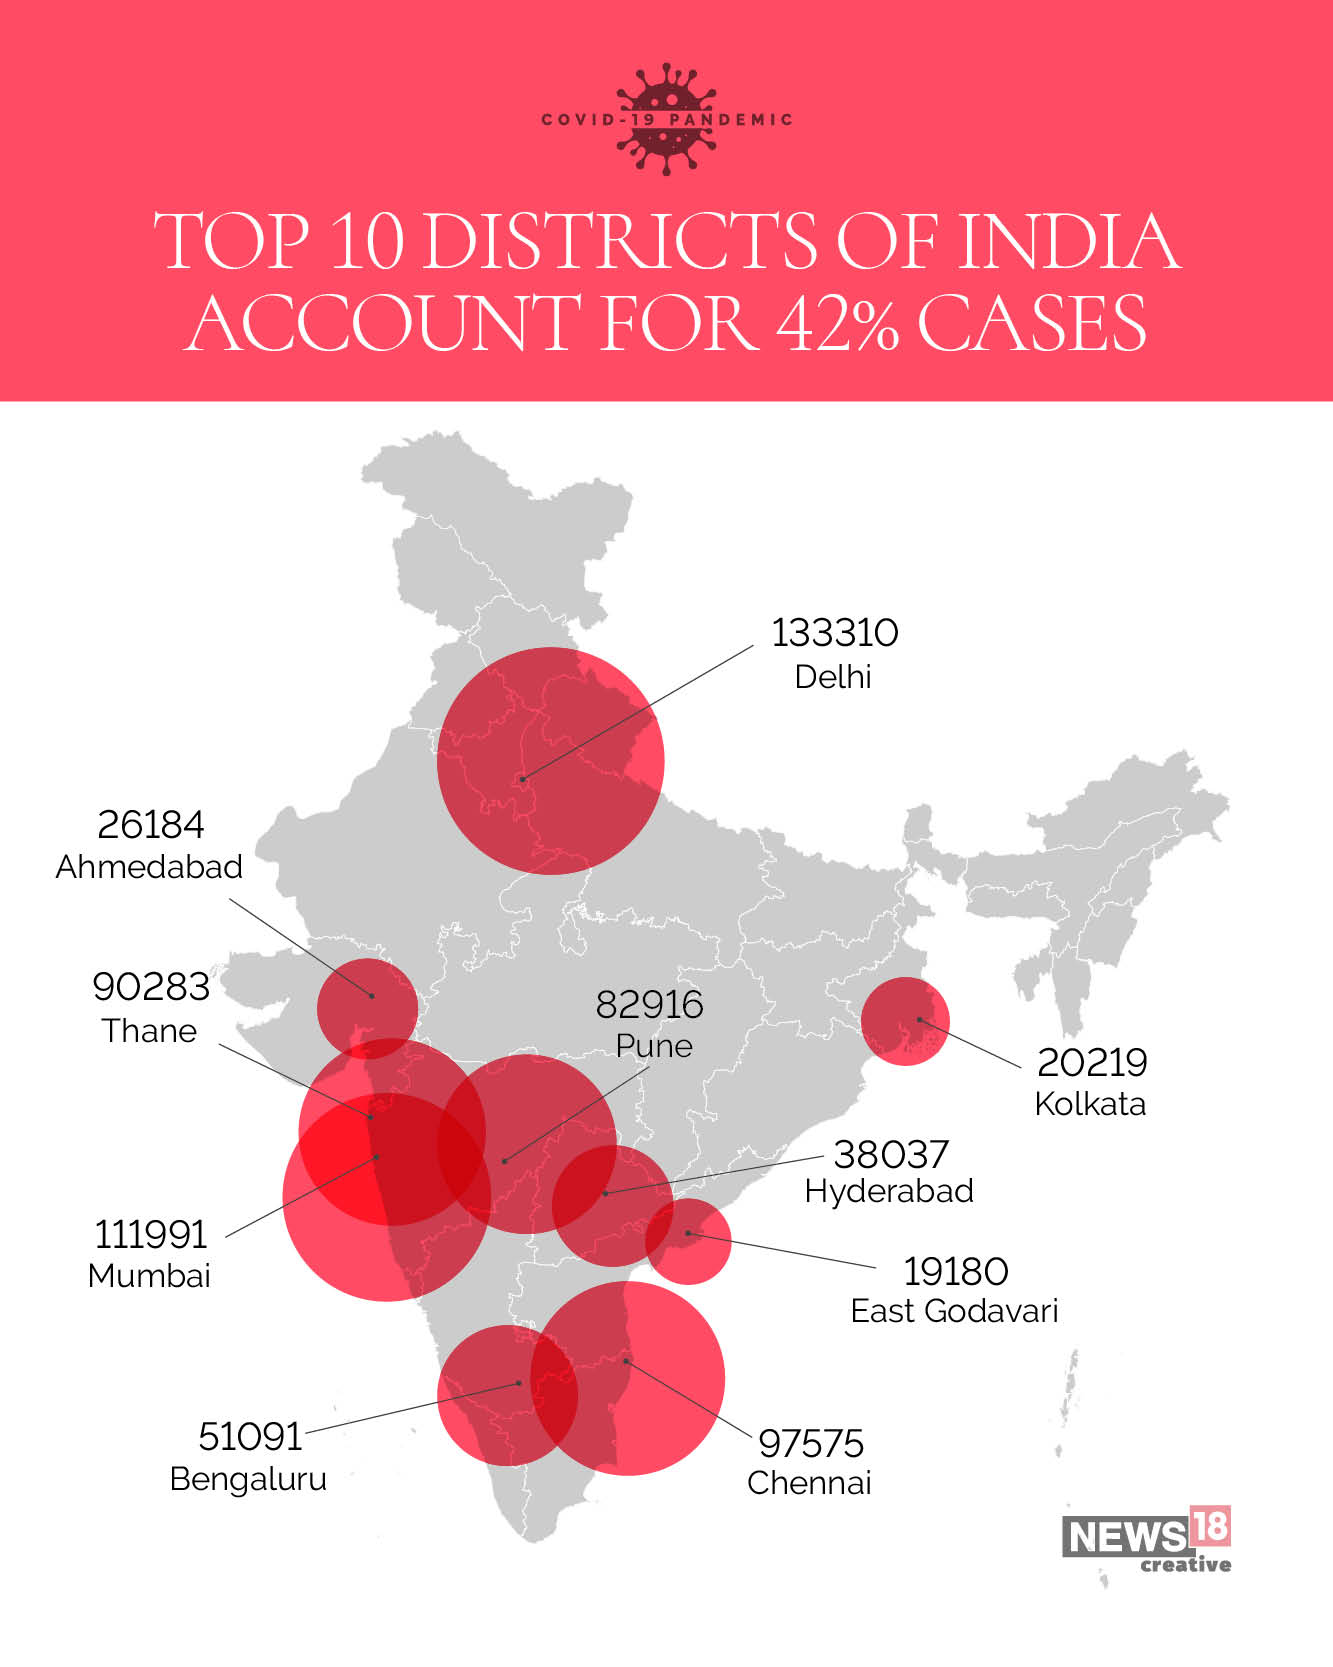
The 10 worst-affected districts of India account for 42% of the total caseload. They also contribute to more than 60% of the total Covid-19 fatalities in the country. Nine out of 10 are state capitals or big urban centres.
A worrying trend has also emerged: increase in the number of cases in smaller non-metro towns and districts, from what has till now been an urban and big town pandemic essentially. East and West Godavari, Palghar, Raigad, Kurnool, Kamrup Metropolitan, Chengalpattu, North 24 Parganas, Nashik, Guntur, Anantapur and Jalgaon are some of the districts which have seen a surge and have more than 10,000 confirmed cases.
In the coming months, the challenge for India would be to control the spread of the virus in rural India.
As the virus-cycle progresses in India, the Recovery Rate has improved from 26% on April 30, to 48% on May 31, to 59% on June 30 and 64% on July 30. This could also indicate that as health and medical facilities have improved, recoveries have overtaken the percentage of active cases.
Overall, the country, despite its population and poverty and other limitation of resources, seems to have controlled the number of fatalities due to Covid-19.